When you get your diabetes lab results back, you might see two numbers that seem to tell the same story: your A1C and your average glucose. One is a percentage, the other is in mg/dL. At first glance, they look different. But they’re both trying to answer the same question: How well is your blood sugar being managed over time? The problem? Many people think they’re interchangeable. They’re not. And misunderstanding the difference can lead to missed risks, poor decisions, and even dangerous blind spots in your care.
What A1C Actually Measures
A1C-also called HbA1c-is a blood test that shows your average blood sugar over the past two to three months. It works by measuring how much glucose has stuck to the hemoglobin in your red blood cells. Red blood cells live for about 120 days, so the test gives you a long-term snapshot. It doesn’t care if you had a spike after dinner last Tuesday or dropped low at 3 a.m. Wednesday. It only sees the big picture.
The American Diabetes Association (ADA) uses A1C ≥6.5% as the official diagnostic cutoff for diabetes. For most adults with diabetes, the target is below 7.0%. But that’s not one-size-fits-all. If you’re older, have heart disease, or get frequent low blood sugars, your doctor might aim for 7.5% or even 8.0%. If you’re younger and healthy, they might push for 6.5% or lower. It’s personal.
What makes A1C so popular? It’s stable. You don’t need to fast. It’s not affected by what you ate that morning or how stressed you were. It’s a reliable, lab-confirmed number that doesn’t change day to day. That’s why doctors rely on it. But here’s the catch: it hides the details.
What Average Glucose Tells You That A1C Doesn’t
When you check your blood sugar with a meter or a continuous glucose monitor (CGM), you’re seeing real-time numbers: 110, 185, 68, 142. These are snapshots. But if you average them over days or weeks, you get something called estimated average glucose (eAG) or Glucose Management Indicator (GMI).
eAG is just A1C converted into mg/dL using a simple formula: 28.7 × A1C - 46.7. So if your A1C is 7.0%, your eAG is 154 mg/dL. That means your average blood sugar over the last few months was around 154 mg/dL. Suddenly, that percentage feels more real. You can picture it.
GMI works the same way-but it’s calculated from your CGM data. If you’ve worn a CGM for 14 days or more, your device can give you a GMI number. It’s more accurate than eAG because it uses hundreds or thousands of readings, not just a lab test.
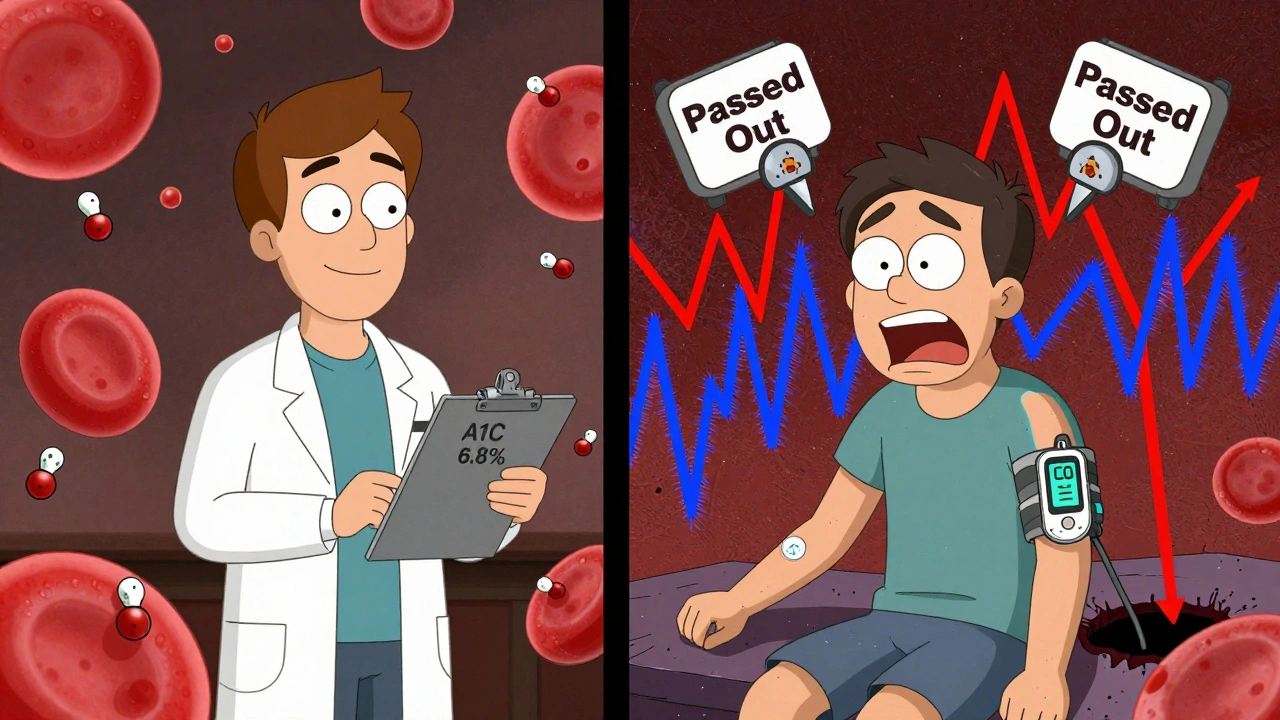
Here’s why this matters: A1C can be normal while your daily glucose is all over the place. You could spend 12 hours a day under 70 mg/dL and 10 hours above 200 mg/dL, and still have an A1C of 6.8%. Your doctor sees “good control.” But you’re living with dangerous swings. That’s not control-that’s chaos.
The Hidden Danger: A1C Can Lie
There are real situations where A1C doesn’t match your true blood sugar pattern. People with anemia, kidney disease, liver disease, or certain blood disorders can have falsely low or high A1C results. Iron deficiency? That can make your A1C look better than it is. Sickle cell trait? That can throw off the test entirely.
Even if your blood is normal, A1C still misses the spikes and drops that cause damage. Research from the Journal of Diabetes Science and Technology shows that glucose variability-those big swings-is a stronger predictor of complications than average levels alone. A1C doesn’t see them. CGM does.
One patient on a diabetes forum said: “My A1C was 6.8%. My doctor said I was doing great. But my CGM showed I was below 70 mg/dL 8% of the time. I passed out twice last month. No one asked about that.” That’s not rare. A 2021 survey found that 31% of people with diabetes had hypoglycemia episodes ignored because their A1C was “in range.”
How to Use Both Numbers Together
The best approach isn’t choosing between A1C and average glucose. It’s using them together.
- Use A1C as your long-term benchmark. Test it every 3-6 months.
- Use eAG or GMI to understand what that percentage feels like in daily life.
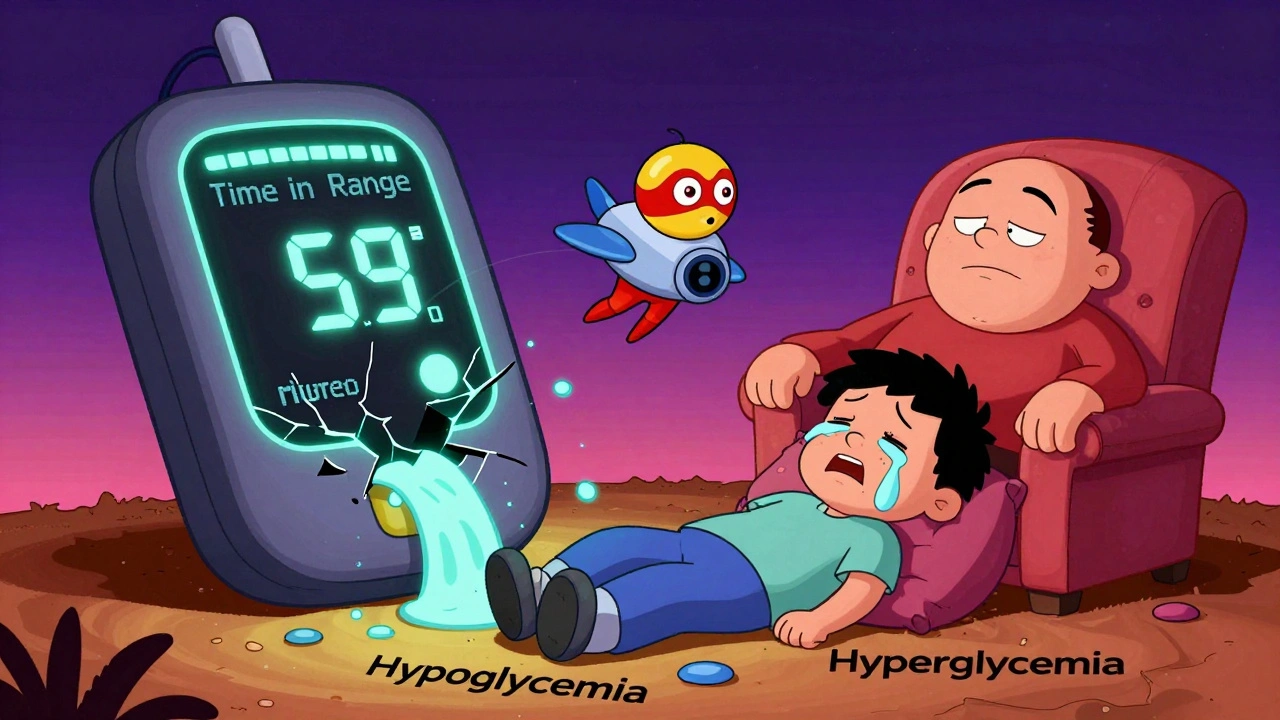
- Use CGM data to see your Time in Range (TIR): how many hours you spend between 70-180 mg/dL. Aim for at least 70%.
- Watch your Time Below 70 mg/dL. Keep it under 4%.
- Watch your Time Above 180 mg/dL. Keep it under 25%.
For example: If your A1C is 7.2% (eAG = 161 mg/dL), but your CGM shows you’re only in range 55% of the time and dropping below 70 mg/dL 6% of the time, your treatment plan needs adjusting. Maybe you’re overcorrecting with insulin at night. Maybe you’re eating too many carbs at dinner. A1C alone won’t tell you that.
Doctors are starting to catch on. The ADA’s 2024 guidelines now recommend using TIR and GMI alongside A1C, especially for people using CGMs. In fact, some clinical trials now use TIR as the main outcome instead of A1C. By 2027, experts predict TIR will become the primary target-and A1C will be the backup.
What Your Targets Should Be
There’s no universal “perfect” number. Your goal depends on your age, health, lifestyle, and risk of low blood sugar.
| Target Metric | General Adult Target | Younger, Healthy Adults | Older Adults or High-Risk |
|---|---|---|---|
| A1C | <7.0% | <6.5% | 7.0-8.0% |
| eAG / GMI (mg/dL) | 154 mg/dL | 140 mg/dL | 154-183 mg/dL |
| Time in Range (70-180 mg/dL) | ≥70% | ≥75% | ≥60% |
| Time Below 70 mg/dL | <4% | <1% | <5% |
| Time Above 180 mg/dL | <25% | <20% | <30% |
These aren’t just numbers. They’re safety zones. Spending too much time above 180 mg/dL slowly damages your nerves, kidneys, and eyes. Spending too much time below 70 mg/dL can cause seizures, falls, or even death.
Real-World Examples
Let’s say you’re 58, have type 2 diabetes, and your A1C is 6.9%. You feel fine. Your doctor says you’re doing great.
But your CGM tells a different story. You’re in range only 58% of the time. You’re below 70 mg/dL for 7% of the day-mostly overnight. You’ve had three unexplained falls in the last three months. Your A1C looks good, but your daily reality is risky.
Now compare that to a 32-year-old with type 1 diabetes. Her A1C is 7.1%, but her CGM shows she’s in range 82% of the time and never goes below 70 mg/dL. Her swings are small. She’s stable. Her A1C is slightly higher, but her health is better.
A1C alone can’t tell you which of these two people is truly doing better. You need the full picture.
What to Do Next
Don’t wait for your next A1C test to understand your control. Here’s what to do right now:
- If you’re not using a CGM, ask your doctor about one. Even a 14-day trial can show you patterns you’ve never seen.
- Check your CGM reports for Time in Range, Time Below, and Time Above. Don’t just look at the average.
- Calculate your GMI. Most CGM apps do it automatically. Compare it to your A1C. If they’re more than 0.5% apart, talk to your provider.
- Write down any lows or highs you notice-even if you think they’re “normal.”
- Bring your CGM data and your A1C to your next appointment. Say: “I want to understand how these numbers fit together.”
Diabetes isn’t about hitting one magic number. It’s about minimizing the swings, staying safe, and living well. A1C is a tool. Average glucose is a tool. But your daily experience? That’s the real data.
Can I trust my A1C if I have anemia?
No-not reliably. Anemia, especially iron-deficiency anemia, can make your A1C appear lower than your actual blood sugar levels. If you have anemia or any condition affecting red blood cells (like sickle cell disease or kidney disease), your doctor should use additional tests like fasting glucose, oral glucose tolerance tests, or CGM data to assess your control.
Why does my CGM average say 140 mg/dL but my A1C is 7.5%?
That’s a sign your blood sugar is spiking higher than your average suggests. The formula for eAG is 28.7 × A1C - 46.7. A 7.5% A1C equals about 171 mg/dL. If your CGM average is only 140 mg/dL, you’re likely having frequent high spikes (like after meals) that aren’t balanced out by lows. You might be underestimating your post-meal highs. Review your CGM graph for patterns after eating.
Is GMI better than A1C?
GMI is more accurate for people using CGMs because it’s based on hundreds of real-time readings over days, not a single lab test. But it’s not a replacement. A1C still matters because it’s standardized, widely available, and not affected by device errors or sensor issues. The best approach is using both: GMI for daily insight, A1C for long-term validation.
What if my A1C is perfect but I still feel tired and foggy?
That’s a red flag. Feeling tired or foggy despite a good A1C often means you’re experiencing frequent highs and lows. Your body is stressed by the swings, not the average. Check your CGM for time below 70 mg/dL or above 180 mg/dL. You might be spending too much time in those zones, even if your average looks fine. Talk to your provider about glucose variability.
How often should I check my A1C?
If your diabetes is stable and you’re meeting your targets, check it every 6 months. If you’ve changed medications, had a recent hospital stay, or aren’t hitting your goals, check it every 3 months. If you use a CGM, you don’t need to wait-review your GMI and Time in Range weekly.


Reviews
A1C is just one piece of the puzzle. I’ve seen too many people celebrate a 6.8% while their CGM shows them dropping to 55 at 3 a.m. every other night. That’s not control-that’s a ticking time bomb.
Doctors need to stop treating percentages like gospel. Real management happens in the hours between tests.
My mum had a stroke last year after years of ‘good A1C’. Turns out she was crashing low every night and no one ever asked. CGM saved her life after we got it. Don’t wait for the next lab visit. Get the data.
YESSSS this!! 🙌 I used to think my A1C was my report card. Now I live by my Time in Range. I’ve got my glucose graph framed like a masterpiece. 70-180 is my happy place. No more guessing, no more panic. Just data.
PS: My dog now barks when my glucose hits 180. He’s a better diabetes coach than my endo.
It’s critical to note that GMI is not a replacement for A1C-it’s a complementary tool. A1C remains the gold standard for population-level epidemiology, clinical trial endpoints, and insurance documentation. But for individualized care? GMI + TIR is the future.
And yes, if your A1C and GMI differ by more than 0.5%, you’ve got a red flag: either sensor drift, lab error, or-most likely-extreme glucose variability. That’s not ‘fine.’ That’s a warning.
Oh wow, another ‘CGM is the answer’ post. I mean, really? You’re telling me we’re gonna ditch a century-old, standardized, lab-certified test for some $1000 gadget that gives false readings because I sneezed too hard? 🤡
Also, ‘Time in Range’? Sounds like a corporate wellness buzzword. Next thing you know, they’ll be charging us per minute spent in the 70-180 zone.
So let me get this straight: the medical industry spent 50 years teaching us to trust A1C… and now they’re saying it’s garbage? Classic. First they said carbs were evil, then fat, then sugar, now it’s ‘variability.’
Meanwhile, my insulin pump just beeped again. I think it’s trying to tell me I’m a failure.
Who really benefits from this ‘new science’? Pharma. CGMs cost $500 a month. A1C tests cost $30. You think they’re pushing this because it’s better for patients? Or because they can sell you a subscription for life?
They don’t want you cured. They want you monitored.
And don’t even get me started on ‘GMI’-that’s just A1C with a tech makeover. Marketing. Pure marketing.
Thank you for this clear, well-researched breakdown. As someone who’s been managing type 2 for over a decade, I’ve seen the shift from ‘just keep your A1C down’ to ‘understand your patterns.’
My biggest takeaway? A1C is like a weather forecast for the last three months. GMI and CGM are the real-time radar showing you where the storm’s actually hitting. One tells you it rained. The other tells you your porch is flooded.
And if you’re not using a CGM yet-please, just try a 14-day trial. It’s not a luxury. It’s a lifeline.
I had a 7.5% A1C and felt fine-until my CGM showed I was under 70 for 8% of the day. I’d been passing out in the shower. No one asked. I didn’t know it was happening.
Now I keep my phone next to my bed. I sleep with a granola bar under my pillow. And I talk to my doctor about numbers I can actually see-not just the ones on paper.
Thank you for saying this out loud.